
With the “create a chart using historical data” prompt, data revolving around a recent history immediately came to my mind. With the election of last week, I chose to depict some presidential information in my chart. Specifically, many people have been commenting on how the votes of various races played a large role in the re-election of President Obama. With this in mind, I created a chart showing the breakdown of Obama voters based on race:
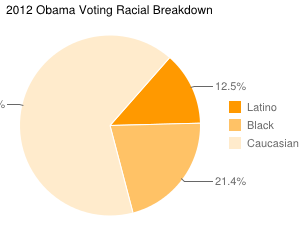
Unfortunately, the caucasian percentage were cut off. However, the breakdown for Caucasian voters was 66.2%